Recent data released by the Brookings Metropolitan Policy Program shows that Cincinnati’s middle class slightly worse off than its Midwestern peers, but is about on pace with the national average.
The study, which categorized individual metropolitan areas and gave regional averages, ranked each city’s population based on six household income categories: Bottom 20% ($21,433 and below); Second 20% ($21,433-$41,109); Middle 20% ($41,110-$65,952); Fourth 20% ($65,952-$106,100); Next 15% ($106,100-$200,000); and Top 5% (Above $200,000).
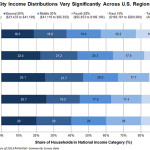
Cincinnati’s percentage of households making less than $21,433, 34.9% of the city’s population, is significantly higher than the Midwestern and national average 25.1% and 20%, respectively. It is also significantly higher than Pittsburgh (27.9%), but lower than Cleveland (43.2%).
The percentage of households in the middle class (I defined this as the Second 20% and Middle 20%), however, is mostly even. Pittsburgh’s middle class population stands at 41.1%, with Cincinnati at 40% and Cleveland at 39.2%. Cincinnati also stands in the middle when it comes to the upper class, with Pittsburgh again leading and Cleveland trailing.
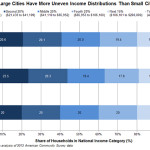
When compared with the rest of Ohio’s cities with more than 100,000 people, Cincinnati is found to have the highest percentage of Top 5% households, while also having the third highest percentage of Bottom 20% households. This, researchers say, follows a national trend where large cities are over-represented in both categories.
A perhaps startling trend is just how poor so many people are across the Midwest and Ohio.
Of Ohio’s four cities with more than 100,000 people, three of them – Cleveland (#2), Toledo (#4) and Cincinnati (#5) – all rank near the top in terms of the highest percentage of their residents falling within the Bottom 20%. While Columbus comes in at #29, this may be due to the city’s large municipal boundaries that account for areas that would in no way be considered part of any of the other three cities.
While, on average, the study found that Midwestern cities tend to have more low income households, and significantly fewer upper class households than the rest of the nation, it also found that Western and Northeastern cities each have high populations of those making over $200,000, although the Northeast has the highest percentage of households making under $21,433.
Researchers did note, however, that these numbers change somewhat when adjusting for cost of housing across metro areas.
Alan Berube, author of the study and a senior fellow and deputy director at the Brookings Metropolitan Policy Program, also noted that despite media portrayals of some cities being entirely poor, and others being entirely wealthy, virtually all American cities still boast a large middle class.


