Categories
Business News

What can UC’s School of Planning do to improve its graduates’ AICP exam pass rates?

The American Planning Association recently published their annual summary of AICP Exam pass rates of graduates from accredited planning programs, and both the University of Cincinnati’s masters and bachelors programs have once come in near the bottom of their respective quartile.

While some industry professionals believe the AICP credential no longer means what is used to, it is still, by and large, the distinguishing professional certification for professional planners.

The University of Cincinnati (UC) is one of just a select group of universities in North America with accredited masters and bachelors planning programs. Between 2004 and 2013, 65 out of 100 Master of Community Planning graduates passed the exam while 34 out of 68 Bachelor of Urban Planning graduates achieved a passing score. The total number of graduates taking the exam for both programs ranks them in the first and second quartiles respectively.

AICP Exam Pass Rates - Bachelor Programs
AICP Exam Pass Rates - Masters Programs

But while the overall number of planning students graduating from the University of Cincinnati’s planning programs is one of the highest in North America, their AICP Exam pass rates of 65% and 50% rank them near the bottom of their respective peers. These average scores also place both programs below the mean pass rate of 71% for accredited planning programs.

“The pass rates for both the MCP and BUP programs are very disappointing,” stated Dr. Danilo Palazzo, Director of UC’s School of Planning. “We have already met with the leadership from the Cincinnati section of APA Ohio and are devising a plan to make our students better aware of the topics covered by the AICP exam.”

One of the ways in which UC officials are hoping to improve this standing is by instituting a new course that would provide an AICP overview for those approaching graduation. The new course, however, does not yet have funding to support it twice per year as envisioned.

“I would like to believe that the pass rates are not a good reflection of the caliber of the professional planning education offered by our programs, though I will not make excuses. These low pass rates are unacceptable,” Dr. Palazzo emphasized. “We are very much open to the comments and suggestions from members of the AICP community, and would appreciate any actionable suggestions from your readers.”

Ohio State University’s Master of City and Regional Planning program, meanwhile, was the only other program in Ohio to be ranked. Its graduates passed the AICP Exam 75% of the time.

EDITORIAL NOTE: UrbanCincy’s owner and managing editor, Randy Simes, is a 2009 graduate of the UC’s Bachelor of Urban Planning program, and UrbanCincy’s local area manager, John Yung, is a 2013 graduate of UC’s Master of Community Planning program. Neither John nor Randy has applied to take the AICP exam.

Categories
Business Development News

Hamilton County Posted Largest Population Gain in Cincinnati MSA in 2013

New population estimates released by the U.S. Census Bureau last week show that Hamilton County’s population slide has ended and that the Cincinnati metropolitan region remains the largest in Ohio, Kentucky and Indiana with more than 2.1 million people.

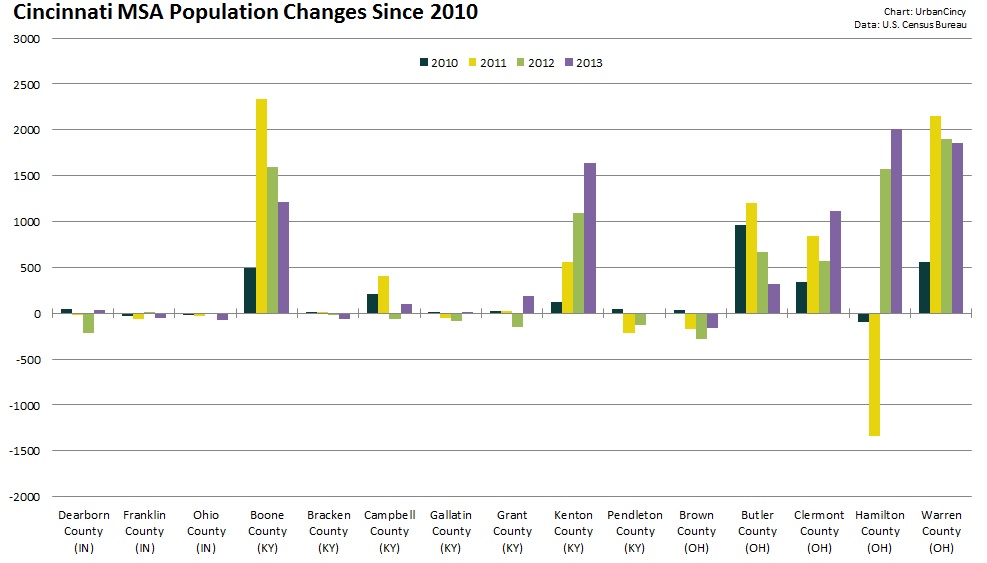
In 2013 Hamilton County added more than 2,000 new people – making it the biggest gainer in the 15-county tri-state region. Warren County came in a close second with just under 2,000 new people.

Boone and Kenton Counties in Kentucky and Clermont County in Ohio also posted population gains of more than 1,000 people. Meanwhile five rural counties in the region saw their population decline, with Brown County in Ohio losing the most at an estimated 165 people.

The Cincinnati region as a whole is estimated to have added just over 8,000 residents in 2013.

Cincinnati MSA Population Changes 2010-2013

Over the past year, the region also posted gains in terms of international migration, but saw continued losses for domestic migration. Net migration to the Cincinnati region was actually negative, but thanks to births significantly outpacing deaths, the region was able to post its overall population gain.

When compared to Columbus and Cleveland, Cincinnati lags in terms of international migration numbers.

Columbus, meanwhile, is the only region out of the big three in Ohio that posted gains in both international and domestic migration – making it the only metropolitan area in the state to have positive net migration in 2013.

Regionally, Hamilton County was the only county to see more than 1,000 new international migrants. But at the same time, Hamilton County also recorded the largest domestic migration loss of any county in the region.

While most all of Hamilton County’s population gains can be attributed to births exceeding deaths, approximately half of Warren County’s gain can be attributed to its positive net migration over the past year. Aside from Warren County, only four other counties in the region experienced positive net migration.

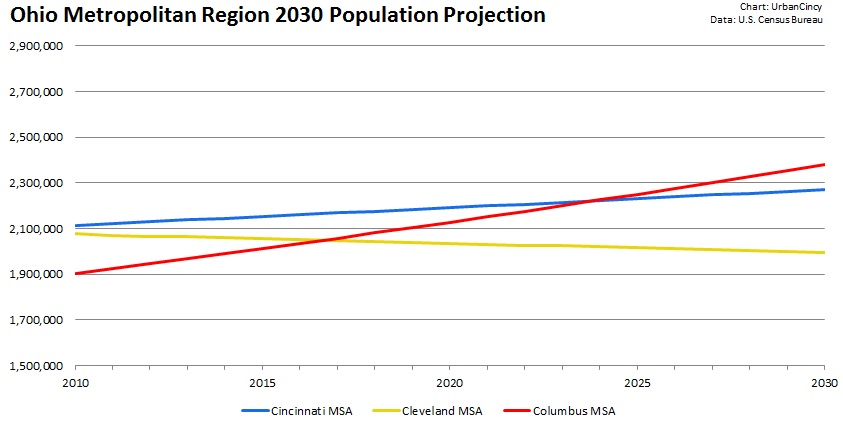
Ohio Metropolitan Region 2030 Population Projection

The population estimates continue to look bad for Cleveland, which recorded regional population loss once again. Since the 2010 Decennial Census, Cleveland has posted average annual population losses of 0.2%, while Cincinnati and Columbus have posted gains of 0.4% and 1.1% respectively.

Should these trends hold over the coming years, Columbus will follow Cincinnati’s lead and pass Cleveland, once the state’s most populous metropolitan region, in terms of overall population by 2017.

Due to the faster growth taking place in Columbus, it will also eventually catch and pass Cincinnati as the state’s most populous region a decade from now. Cleveland, meanwhile, will see its regional population dip below two million in 15 years.

A long forecasted but yet realized trend appears to be taking hold in the second decade of the new millennium. Instead of cities bleeding population to suburban areas, rural areas are now losing their population to suburban areas while cities hold on to their core population while also continuing to attract international and some domestic migrants from suburban and rural areas.

The Decennial Census in 2010 was a splash of cold water for many cities, including Cincinnati, who had thought that they had already reversed decades of population loss. Perhaps these new trends, now being realized, will finally result in the population gain so many cities have been longing for in 2020.

Categories
Business Development News

How do the housing markets in Ohio’s largest metropolitan regions compare?

A surge of new home construction rang in the new millennium just over a decade ago, but that surge quickly ended when the now infamous housing bubble burst, subsequently leading to the Great Recession.

In recent years the economy has begun to rebound, but the housing market still has not quite come back. In particular, the home ownership housing market has not come back.

This had led to a new surge of housing construction as developers work to build product for a still growing U.S. population. Cities have seen much of this new apartment construction as the rebounding economy has coincided with the entrance of Millennials into the housing market.

The narrative has been that rentals are surging while home ownership is sagging, but according to newly released data from the U.S. Census Bureau, this common narrative is only partly true.

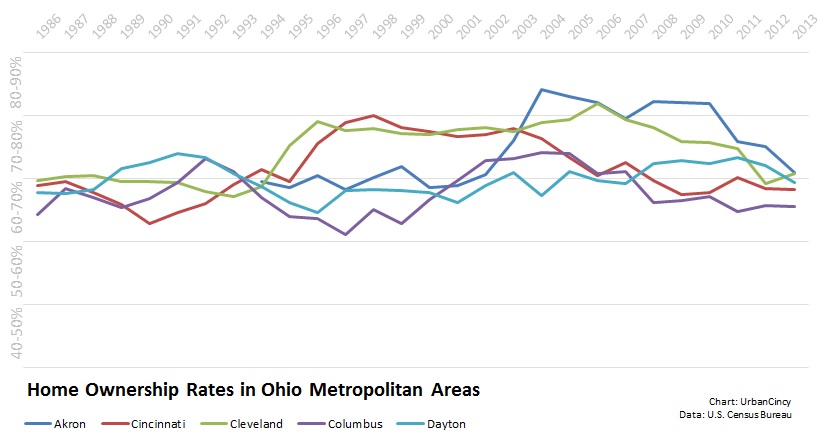
Home Ownership Rates in Ohio MSAs
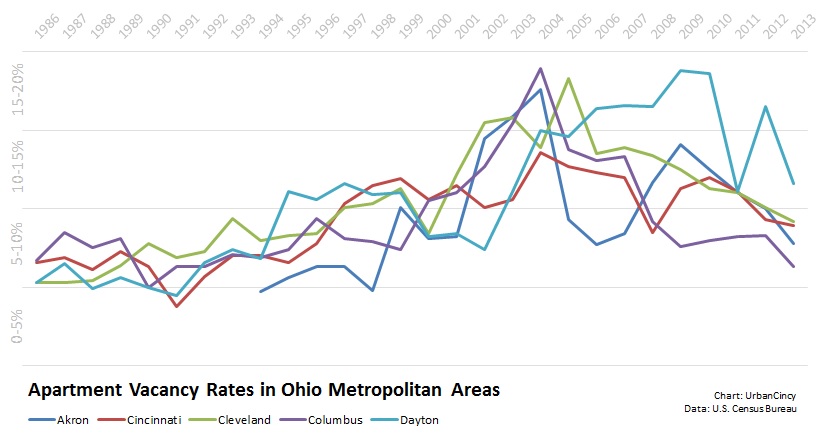
Apartment Vacancy Rate in Ohio MSAs

In Ohio’s five largest metropolitan regions the data shows that home ownership rates have settled out around the same levels they were at nearly two decades ago. And while apartment vacancy rates have been plummeting in recent years, they are still higher than they were in the 1980s and 1990s.

Akron and Cleveland are virtually tied for the highest home ownership rates in Ohio at 66%, but this is down from their respective peaks of 80% and 77% around the height of the housing bubble. At 61%, Columbus scores the lowest of Ohio’s five biggest metropolitan regions in terms of home ownership.

Columbus boasts the state’s lowest apartment vacancy rate at 6%, which is approaching the capital city’s all-time lowest apartment vacancy rate of 5% in 1990. The Dayton region has the highest apartment vacancy rate in the state, with its apartments sitting empty nearly twice as much as those in Columbus.

Both when it comes to home ownership and apartment vacancy rate, Cincinnati seems to serve as the state’s trend line. For the year ending 2013, the Queen City had a home ownership rate of 63% and an apartment vacancy rate of 9%.

While the aforementioned data seems to cloud the discussion about housing market trends, additional data also shows that overall inventory and prices of owner-occupied units is decreasing, while inventory and pricing of rental units is increasing.

Locally, Cincinnati is in the midst of an apartment building boom, with thousands of units across the region currently under construction. While home permits have increased recently, those numbers pale in comparison.