Categories
Development News

Nationwide Housing Shortage Most Dire For Those at the Bottom

For those at the lowest rungs of America’s economic classes, the affordable housing crisis is bad and getting worse. According to a 2011-2013 study released in 2015 from the Urban Institute, not a single county in the United States has an adequate supply of affordable housing for those in extreme poverty. Families classified as extremely low-income (ELI), or those making less than 30 percent of an area’s median household income, have far less options today than in 2000. On average nationally, only 28 affordable units are available for every 100 ELI renter households. That represents a 25% decrease in the years since 2000, when there were 37 affordable units for every 100 ELI households.

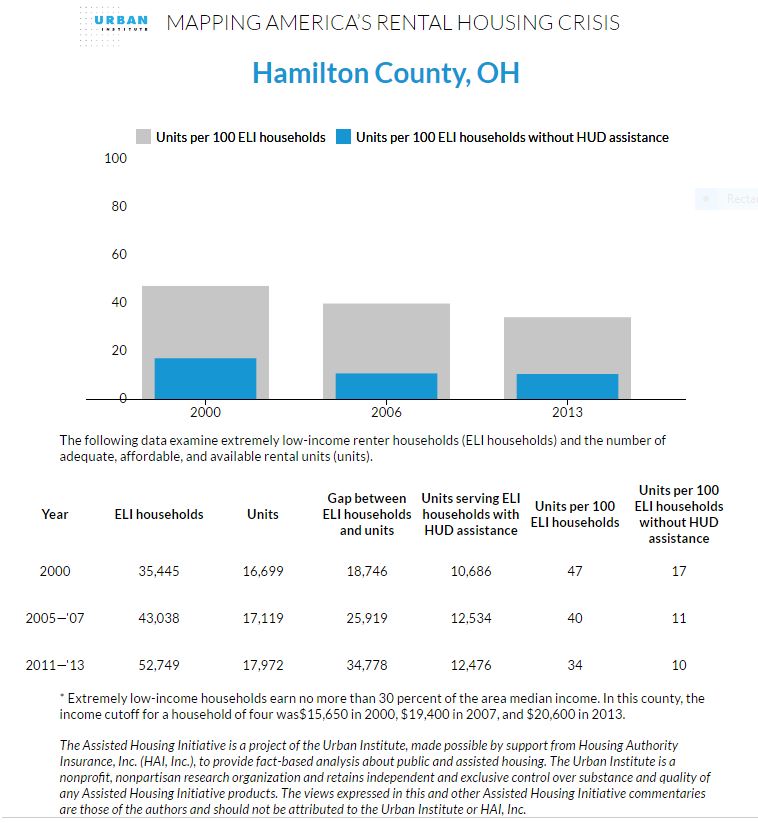
In Hamilton County, there are 52,749 ELI households (making $20,600 or less), with only 17,972 affordable units. This amounts to around 34 affordable and adequate units for every 100 households. In 2000, there were 47 units for every 100 ELI renter households. As usual, most of Cincinnati’s peer cities are facing a similar situation for their region’s poorest residents. In Cuyahoga County (Cleveland), there exist only 31 affordable units out of 100 families today, compared with 44 in 2000. In Allegheny County (Pittsburgh), there are 35 units per 100 families today while there were 44 per 100 in 2000.

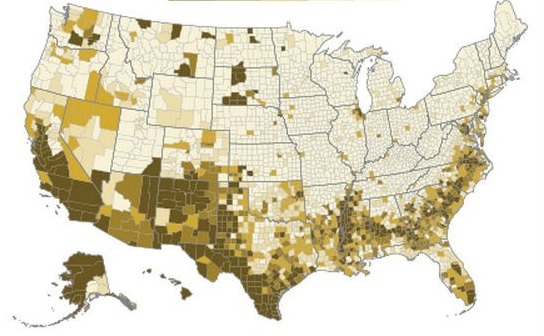
Since 2000, many rural and suburban counties have joined metropolitan counties in their extremely low numbers of available units per needy households. The change is visibly stark on the Infographic for the State of Ohio, As the Urban Institute notes, the most drastic changes have occurred in the Midwest, South, and West in states like Ohio, Kentucky, Alabama, and Nevada, where comparatively abundant ELI housing availability in 2000 has plummeted.

The last 16 years have also seen ELI families increasingly reliant upon federal assistance for housing. The Great Recession, rising prices in many metropolitan areas, stagnant wages, and lack of development mean that while only 57% of families relied on HUD in 2000, more than 80% do now.

Indeed, while the Urban Institute points out that federal assistance for housing has grown (albeit not enough), they also acknowledge that many in the US Congress frequently call for cuts to federal housing assistance provided through the Department of Housing and Urban Development (HUD). Without this federal assistance, an already-dire situation for ELI families becomes catastrophic. Accounting for a theoretical total cut in federal housing assistance, there would exist only 5 affordable units for every 100 ELI renter household. That amounts to a mere 609,802 units for 11,341,484 ELI households. In Hamilton County specifically, there would be only 10 units for every 100 households. Cuyahoga and Allegheny Counties fair even worse, with only 5 and 3 units per 100 ELI renter households, respectively.

While the nationwide housing crisis has been much-discussed, including on this site, the true scope of the problem is most visible at the bottom of the economic spectrum. The biggest loss in affordable housing for extremely low income families has occurred mostly in unassisted units, highlighting the need for more affordable developments nationwide. Without increased federal assistance, along with more and smarter development across the nation, many will be driven to homelessness and unsafe & overcrowded housing.
Categories
Business News Politics

Roughly 39% of Hamilton County’s Workforce Commutes From Outside of County

Of the 490,222 workers in Hamilton County, 39% of them are commuters from outside the county. This is according to data released by the U.S. Census Bureau.

Compared to other similarly sized metropolitan areas, this is a larger than normal percentage. In Cuyahoga County, home of Cleveland, for example, only 28% of the almost 700,000 workers commute from outside the county; and in Allegheny County, PA – the center of the Pittsburgh metropolitan area – that number is 22% of more than 680,000 workers.

The difference, some say, may be attributable to the fact that the Cincinnati region’s job center sits directly on a state line, and borders three counties in Northern Kentucky.

However, in Jefferson County, KY, with a similar amount of workers in the county as Hamilton County, only 26% of employees commute from outside Jefferson County. This is in spite of the fact that Louisville sits directly on the Ohio River, like Cincinnati, with commuters crossing the state line from Indiana each day.

Perhaps further explaining the matter is the merging of Cincinnati and Dayton’s economic activities, which increasingly promote cross commuting between Cincinnati’s northern, and Dayton’s southern counties.

Such commuting patterns complicate transportation management for regional planners. Not only does it mean heavy rush hour commutes, but also more unpredictable reverse commutes.

While Hamilton County was a bit of an outlier, it was joined by Davidson County, TN (Nashville), and St. Louis County, MO (St. Louis) with similar complex commuting patterns.

Categories
Up To Speed

The huge demographic shift that is changing the face of America

The huge demographic shift that is changing the face of America.

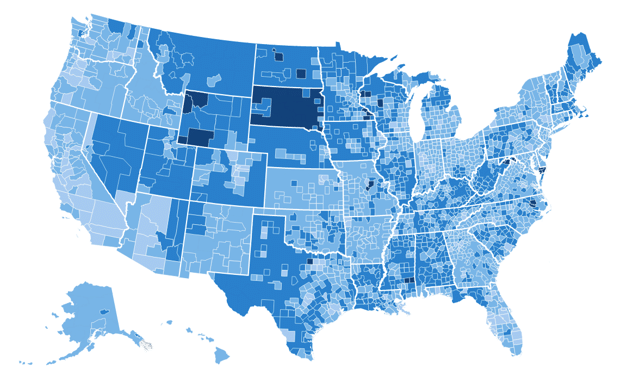
Between 2000 and 2013, an additional 78 counties throughout the United States joined the rank of those where whites no longer made up a majority of the population. In total there are some 266 counties nation-wide, including Ohio’s three most populous. More from CityLab:

By 2040, the country’s white population will no longer be the majority. But for many regions around the country, this demographic shift has already arrived. A new map created by the Pew Research Center pinpoints the 78 counties in 19 states where, from 2000 to 2013, minorities together outnumbered the white population.

Pew crunched Census numbers from the 2,440 U.S. counties that had more than 10,000 residents in 2013. Whites made up less than half the population in a total of 266 counties. Even though these 266 counties made up only 11 percent of the counties analyzed, they contained 31 percent of the country’s total population, with many of them home to dense urban areas.

Categories
Business Development News

Hamilton County Posted Largest Population Gain in Cincinnati MSA in 2013

New population estimates released by the U.S. Census Bureau last week show that Hamilton County’s population slide has ended and that the Cincinnati metropolitan region remains the largest in Ohio, Kentucky and Indiana with more than 2.1 million people.

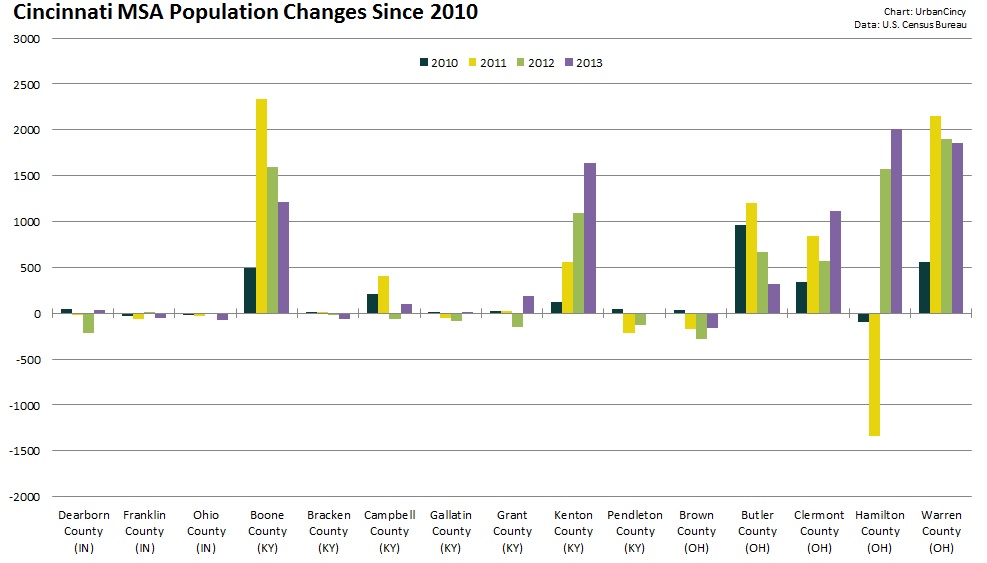
In 2013 Hamilton County added more than 2,000 new people – making it the biggest gainer in the 15-county tri-state region. Warren County came in a close second with just under 2,000 new people.

Boone and Kenton Counties in Kentucky and Clermont County in Ohio also posted population gains of more than 1,000 people. Meanwhile five rural counties in the region saw their population decline, with Brown County in Ohio losing the most at an estimated 165 people.

The Cincinnati region as a whole is estimated to have added just over 8,000 residents in 2013.

Cincinnati MSA Population Changes 2010-2013

Over the past year, the region also posted gains in terms of international migration, but saw continued losses for domestic migration. Net migration to the Cincinnati region was actually negative, but thanks to births significantly outpacing deaths, the region was able to post its overall population gain.

When compared to Columbus and Cleveland, Cincinnati lags in terms of international migration numbers.

Columbus, meanwhile, is the only region out of the big three in Ohio that posted gains in both international and domestic migration – making it the only metropolitan area in the state to have positive net migration in 2013.

Regionally, Hamilton County was the only county to see more than 1,000 new international migrants. But at the same time, Hamilton County also recorded the largest domestic migration loss of any county in the region.

While most all of Hamilton County’s population gains can be attributed to births exceeding deaths, approximately half of Warren County’s gain can be attributed to its positive net migration over the past year. Aside from Warren County, only four other counties in the region experienced positive net migration.

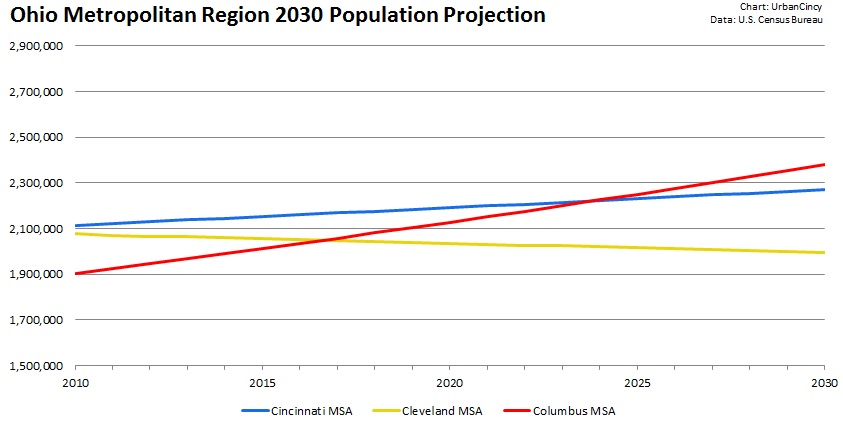
Ohio Metropolitan Region 2030 Population Projection

The population estimates continue to look bad for Cleveland, which recorded regional population loss once again. Since the 2010 Decennial Census, Cleveland has posted average annual population losses of 0.2%, while Cincinnati and Columbus have posted gains of 0.4% and 1.1% respectively.

Should these trends hold over the coming years, Columbus will follow Cincinnati’s lead and pass Cleveland, once the state’s most populous metropolitan region, in terms of overall population by 2017.

Due to the faster growth taking place in Columbus, it will also eventually catch and pass Cincinnati as the state’s most populous region a decade from now. Cleveland, meanwhile, will see its regional population dip below two million in 15 years.

A long forecasted but yet realized trend appears to be taking hold in the second decade of the new millennium. Instead of cities bleeding population to suburban areas, rural areas are now losing their population to suburban areas while cities hold on to their core population while also continuing to attract international and some domestic migrants from suburban and rural areas.

The Decennial Census in 2010 was a splash of cold water for many cities, including Cincinnati, who had thought that they had already reversed decades of population loss. Perhaps these new trends, now being realized, will finally result in the population gain so many cities have been longing for in 2020.