Categories
Business Development News

Hamilton County Posted Largest Population Gain in Cincinnati MSA in 2013

New population estimates released by the U.S. Census Bureau last week show that Hamilton County’s population slide has ended and that the Cincinnati metropolitan region remains the largest in Ohio, Kentucky and Indiana with more than 2.1 million people.

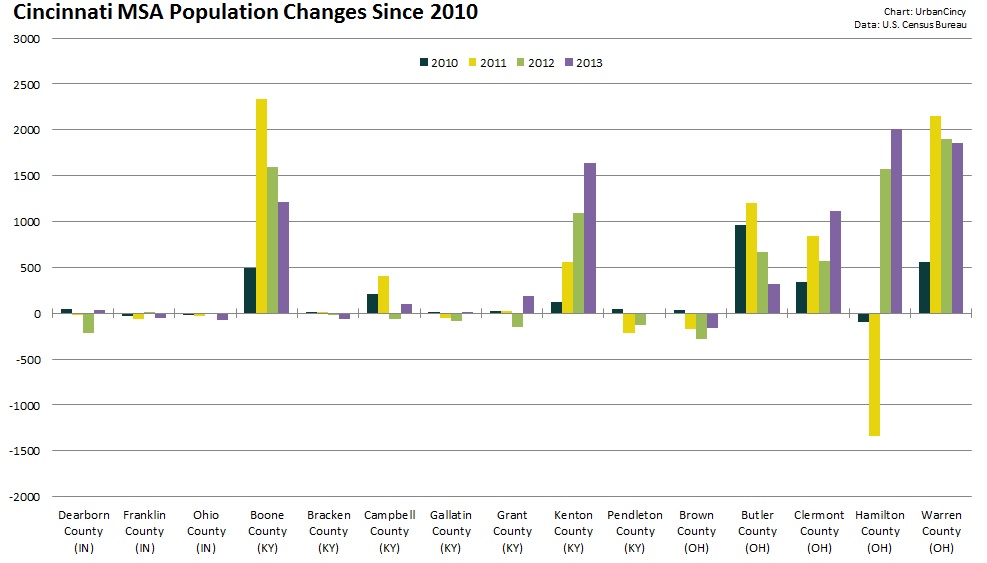
In 2013 Hamilton County added more than 2,000 new people – making it the biggest gainer in the 15-county tri-state region. Warren County came in a close second with just under 2,000 new people.

Boone and Kenton Counties in Kentucky and Clermont County in Ohio also posted population gains of more than 1,000 people. Meanwhile five rural counties in the region saw their population decline, with Brown County in Ohio losing the most at an estimated 165 people.

The Cincinnati region as a whole is estimated to have added just over 8,000 residents in 2013.

Cincinnati MSA Population Changes 2010-2013

Over the past year, the region also posted gains in terms of international migration, but saw continued losses for domestic migration. Net migration to the Cincinnati region was actually negative, but thanks to births significantly outpacing deaths, the region was able to post its overall population gain.

When compared to Columbus and Cleveland, Cincinnati lags in terms of international migration numbers.

Columbus, meanwhile, is the only region out of the big three in Ohio that posted gains in both international and domestic migration – making it the only metropolitan area in the state to have positive net migration in 2013.

Regionally, Hamilton County was the only county to see more than 1,000 new international migrants. But at the same time, Hamilton County also recorded the largest domestic migration loss of any county in the region.

While most all of Hamilton County’s population gains can be attributed to births exceeding deaths, approximately half of Warren County’s gain can be attributed to its positive net migration over the past year. Aside from Warren County, only four other counties in the region experienced positive net migration.

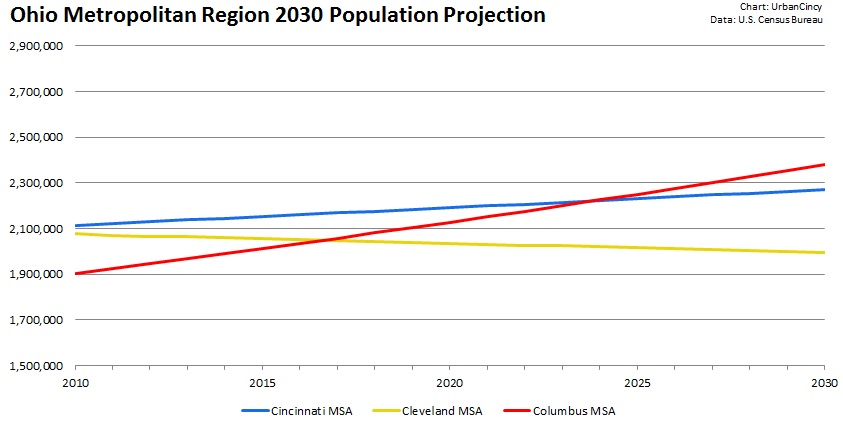
Ohio Metropolitan Region 2030 Population Projection

The population estimates continue to look bad for Cleveland, which recorded regional population loss once again. Since the 2010 Decennial Census, Cleveland has posted average annual population losses of 0.2%, while Cincinnati and Columbus have posted gains of 0.4% and 1.1% respectively.

Should these trends hold over the coming years, Columbus will follow Cincinnati’s lead and pass Cleveland, once the state’s most populous metropolitan region, in terms of overall population by 2017.

Due to the faster growth taking place in Columbus, it will also eventually catch and pass Cincinnati as the state’s most populous region a decade from now. Cleveland, meanwhile, will see its regional population dip below two million in 15 years.

A long forecasted but yet realized trend appears to be taking hold in the second decade of the new millennium. Instead of cities bleeding population to suburban areas, rural areas are now losing their population to suburban areas while cities hold on to their core population while also continuing to attract international and some domestic migrants from suburban and rural areas.

The Decennial Census in 2010 was a splash of cold water for many cities, including Cincinnati, who had thought that they had already reversed decades of population loss. Perhaps these new trends, now being realized, will finally result in the population gain so many cities have been longing for in 2020.

Categories
Business News Transportation

Data Suggests Peak Vehicle Miles Traveled Was Reached in 2007

Whether it is widening Martin Luther King Drive, adding a new interchange, building a new bridge, or adding additional capacity to existing streets throughout our cities, we always hear of the robust traffic growth that is anticipated. If nothing is done, then our communities would be stuck in gridlock.

But how have these projections actually measured up?

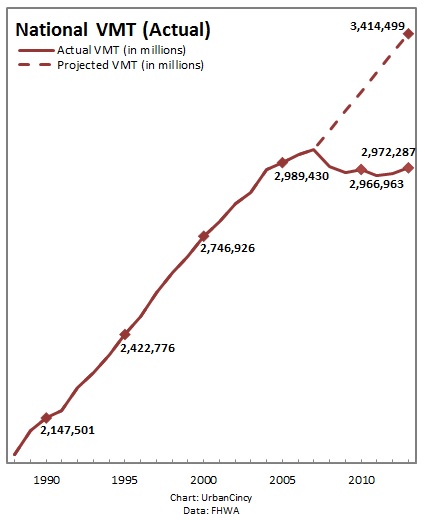
According to data from the Federal Highway Administration (FHWA) and cross examined with data from the U.S. Census Bureau, the traffic growth projections made by departments of transportation all over the country have been wildly off-base for the past decade.

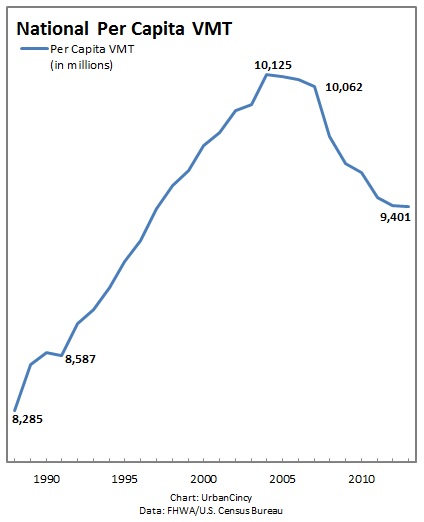
National VMT (Actual) National Per Capita VMT

Since the 1980s, traffic on our roadways, as measured by vehicle miles traveled (VMT), has increased by approximately 2.5% annually. That is until the early 2000s when that trend changed rather abruptly. Since 2007, actual VMT has decreased approximately .3% annually. Meanwhile, per capita VMT has fallen sharply.

Many analysts have noticed the trends, but have been cautious to make any judgments about them due to the fact that the change took place around the same time as the Great Recession. The common thought was that people without jobs drive less. Even though most economists, however, have noticed a rebounding economy over recent years, both actual and per capita VMT continues to decline.

The persistent trends may in fact be the new normal for America as Baby Boomers retire and Millennials and subsequent generations continue their pivot away from personal automobile use. If this is the case, it appears that the United States hit peak VMT in 2007.

The implications pose serious policy questions. Presently, most departments of transportation spend most of their money annually on new capacity projects, while letting existing infrastructure crumble. Some policy makers and organizations, like Smart Growth America and President Obama (D), who first proposed such a program during his 2013 State of the Union Address, have advocated for a shift in this position to a ‘Fix-It-First’ approach.

Time will only tell what future trends will show. But as of now we are experiencing, for the first time in our nation’s history, a constant period of decline in terms of the amount of driving we are doing.

Categories
Up To Speed

Will Detroit actually demolish 117,000 buildings over the next five years?

Will Detroit actually demolish 117,000 buildings over the next five years?.

At the end of 2012 we sounded the alarm about a new grant from the State of Ohio that would allow for Hamilton County leaders to demolish approximately 700 buildings in the name of blight removal. Well try this on for size: the City of Detroit has proposed increasing its blight removal budget so that it can demolish 400 to 450 buildings a week over the next five years. For those keeping score, that would be anywhere from 104,000 to 117,000 total demolitions. More from The Detroit News:

Orr filed his debt-cutting plan of adjustment last month in U.S. Bankruptcy Court and continues to meet opposition from retirees and other city creditors, but says his main focus is getting Detroit on track for its 700,000 residents.

Orr’s plan calls for the infusion of $1.5 billion into capital improvements over the next decade. Among them is an ambitious plan to target Detroit’s blight that Orr insists is “doable.” Orr dedicated about $520 million to blight removal over the next five years. The funding would ramp up demolitions from 114 a week to between 400 and 450.

Categories
Business Development News

How do the housing markets in Ohio’s largest metropolitan regions compare?

A surge of new home construction rang in the new millennium just over a decade ago, but that surge quickly ended when the now infamous housing bubble burst, subsequently leading to the Great Recession.

In recent years the economy has begun to rebound, but the housing market still has not quite come back. In particular, the home ownership housing market has not come back.

This had led to a new surge of housing construction as developers work to build product for a still growing U.S. population. Cities have seen much of this new apartment construction as the rebounding economy has coincided with the entrance of Millennials into the housing market.

The narrative has been that rentals are surging while home ownership is sagging, but according to newly released data from the U.S. Census Bureau, this common narrative is only partly true.

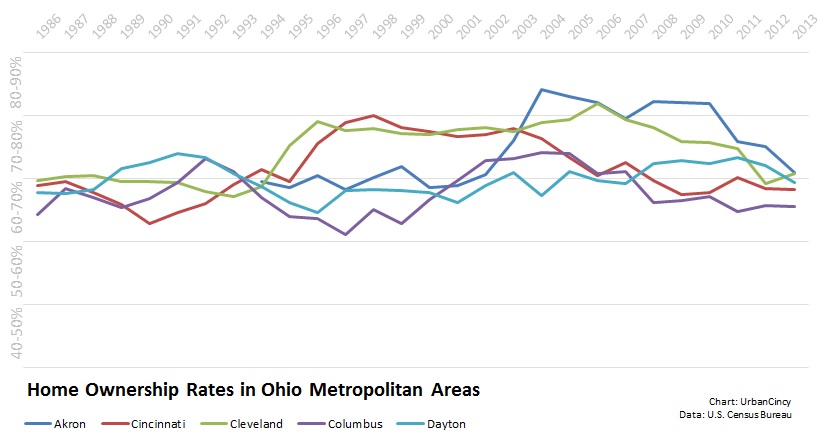
Home Ownership Rates in Ohio MSAs
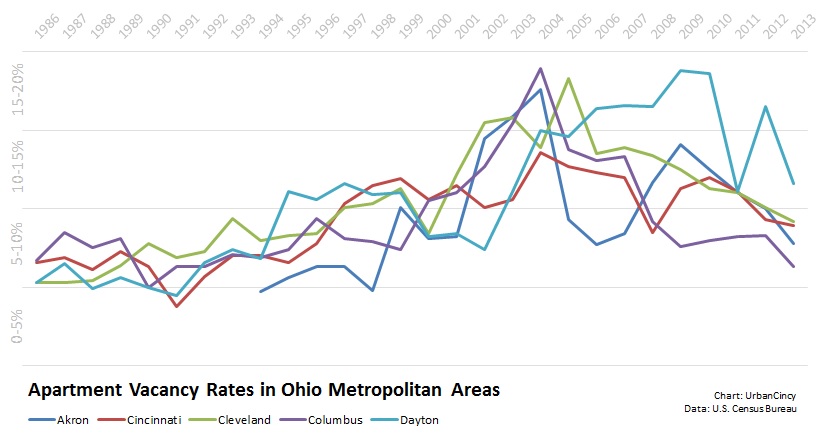
Apartment Vacancy Rate in Ohio MSAs

In Ohio’s five largest metropolitan regions the data shows that home ownership rates have settled out around the same levels they were at nearly two decades ago. And while apartment vacancy rates have been plummeting in recent years, they are still higher than they were in the 1980s and 1990s.

Akron and Cleveland are virtually tied for the highest home ownership rates in Ohio at 66%, but this is down from their respective peaks of 80% and 77% around the height of the housing bubble. At 61%, Columbus scores the lowest of Ohio’s five biggest metropolitan regions in terms of home ownership.

Columbus boasts the state’s lowest apartment vacancy rate at 6%, which is approaching the capital city’s all-time lowest apartment vacancy rate of 5% in 1990. The Dayton region has the highest apartment vacancy rate in the state, with its apartments sitting empty nearly twice as much as those in Columbus.

Both when it comes to home ownership and apartment vacancy rate, Cincinnati seems to serve as the state’s trend line. For the year ending 2013, the Queen City had a home ownership rate of 63% and an apartment vacancy rate of 9%.

While the aforementioned data seems to cloud the discussion about housing market trends, additional data also shows that overall inventory and prices of owner-occupied units is decreasing, while inventory and pricing of rental units is increasing.

Locally, Cincinnati is in the midst of an apartment building boom, with thousands of units across the region currently under construction. While home permits have increased recently, those numbers pale in comparison.

Categories
News Politics Transportation

What would moving Hamilton County BOE mean for those without cars?

Unsurprisingly, Ohio Secretary of State Jon Husted (R) has sided with his fellow Republicans in Hamilton County and cleared the way for Hamilton County’s Board of Election offices to move from Downtown to Mt. Airy. The ruling came as a result of the Hamilton County BOE’s deadlocked vote on the matter, which went along party lines.

Such a move will not happen for several years, but when it does it will make Hamilton County the only urban county in Ohio without its election offices located in its downtown.

Democrats seem to fear that the move will make early voting more difficult for the tens of thousands of residents who do not own a car. Republicans, on the other hand, seem giddy with the prospect of the new site being surrounded by an abundance of “free” surface parking options.

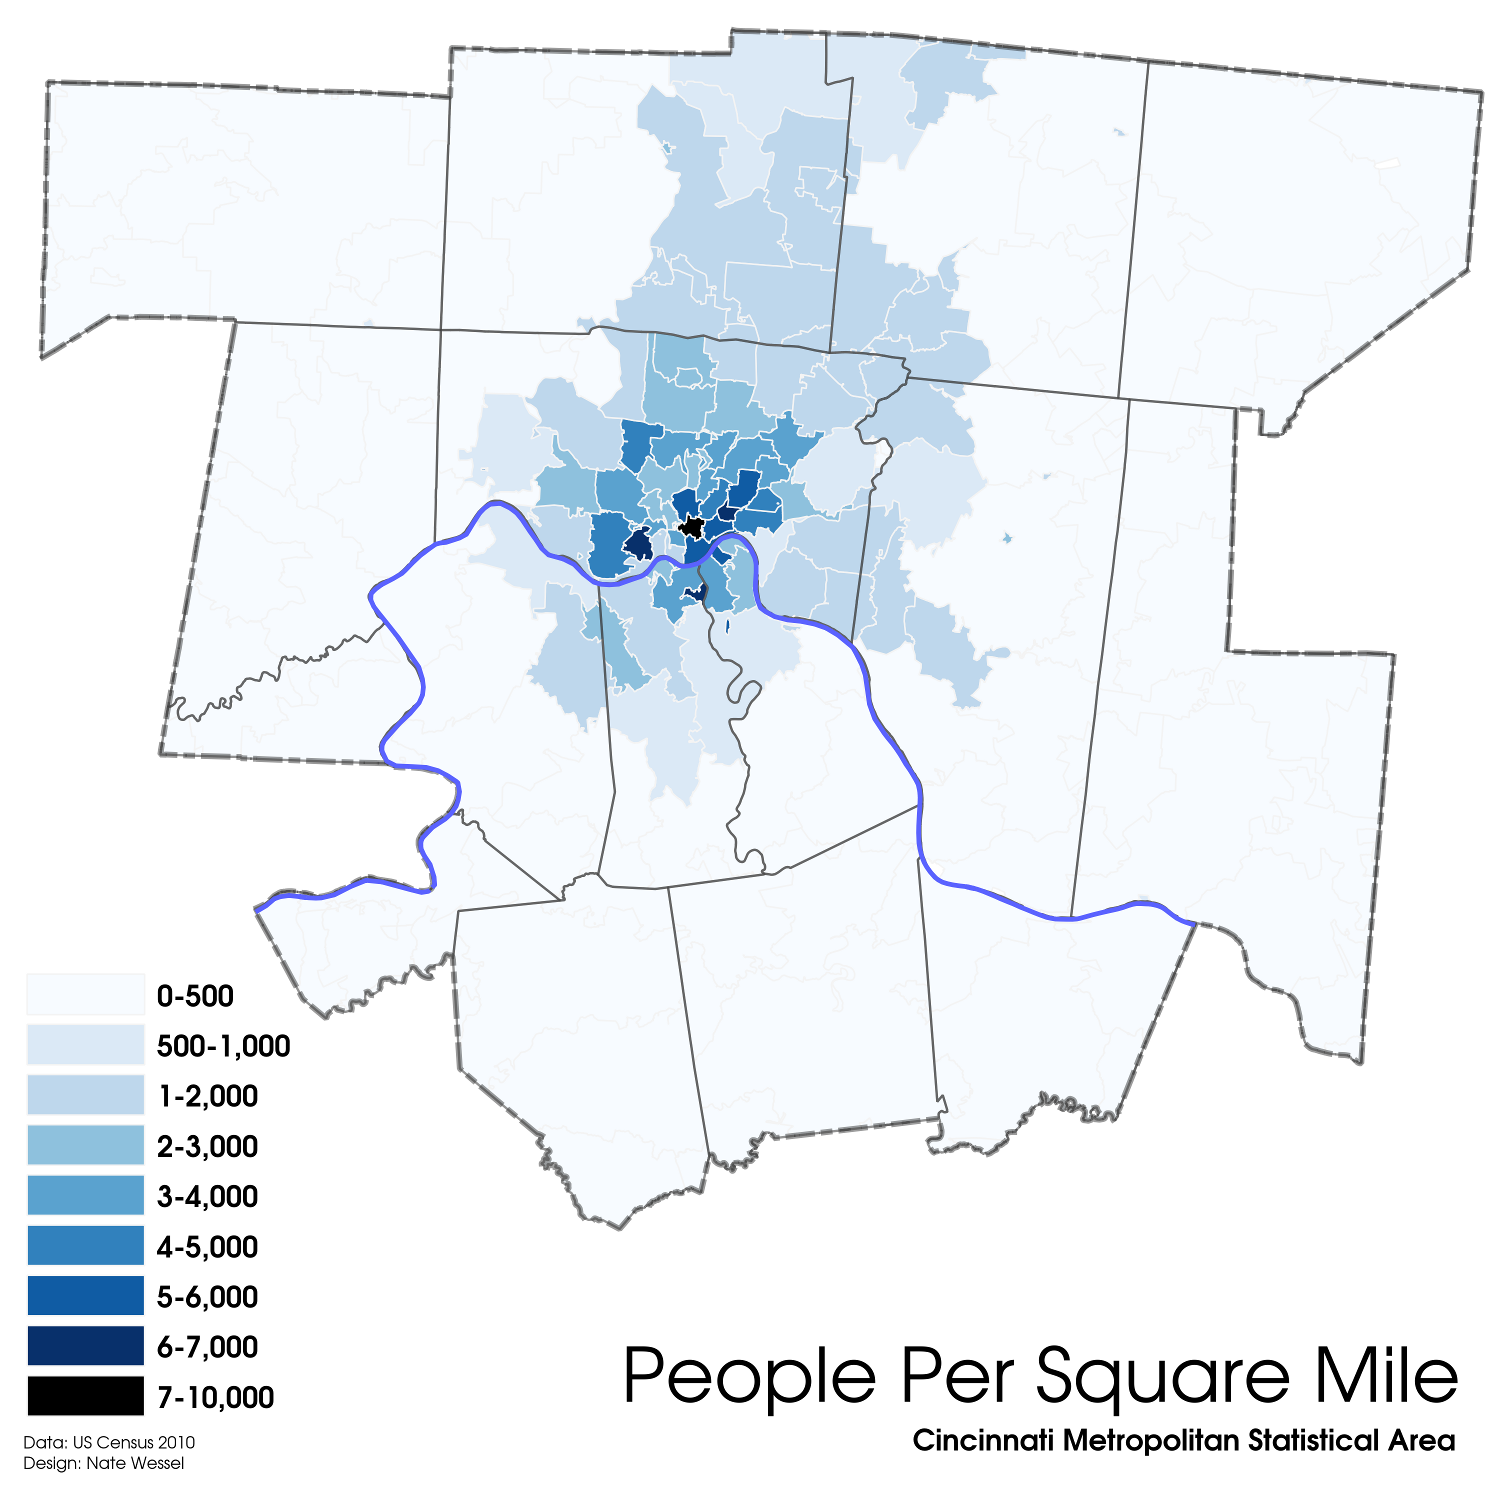
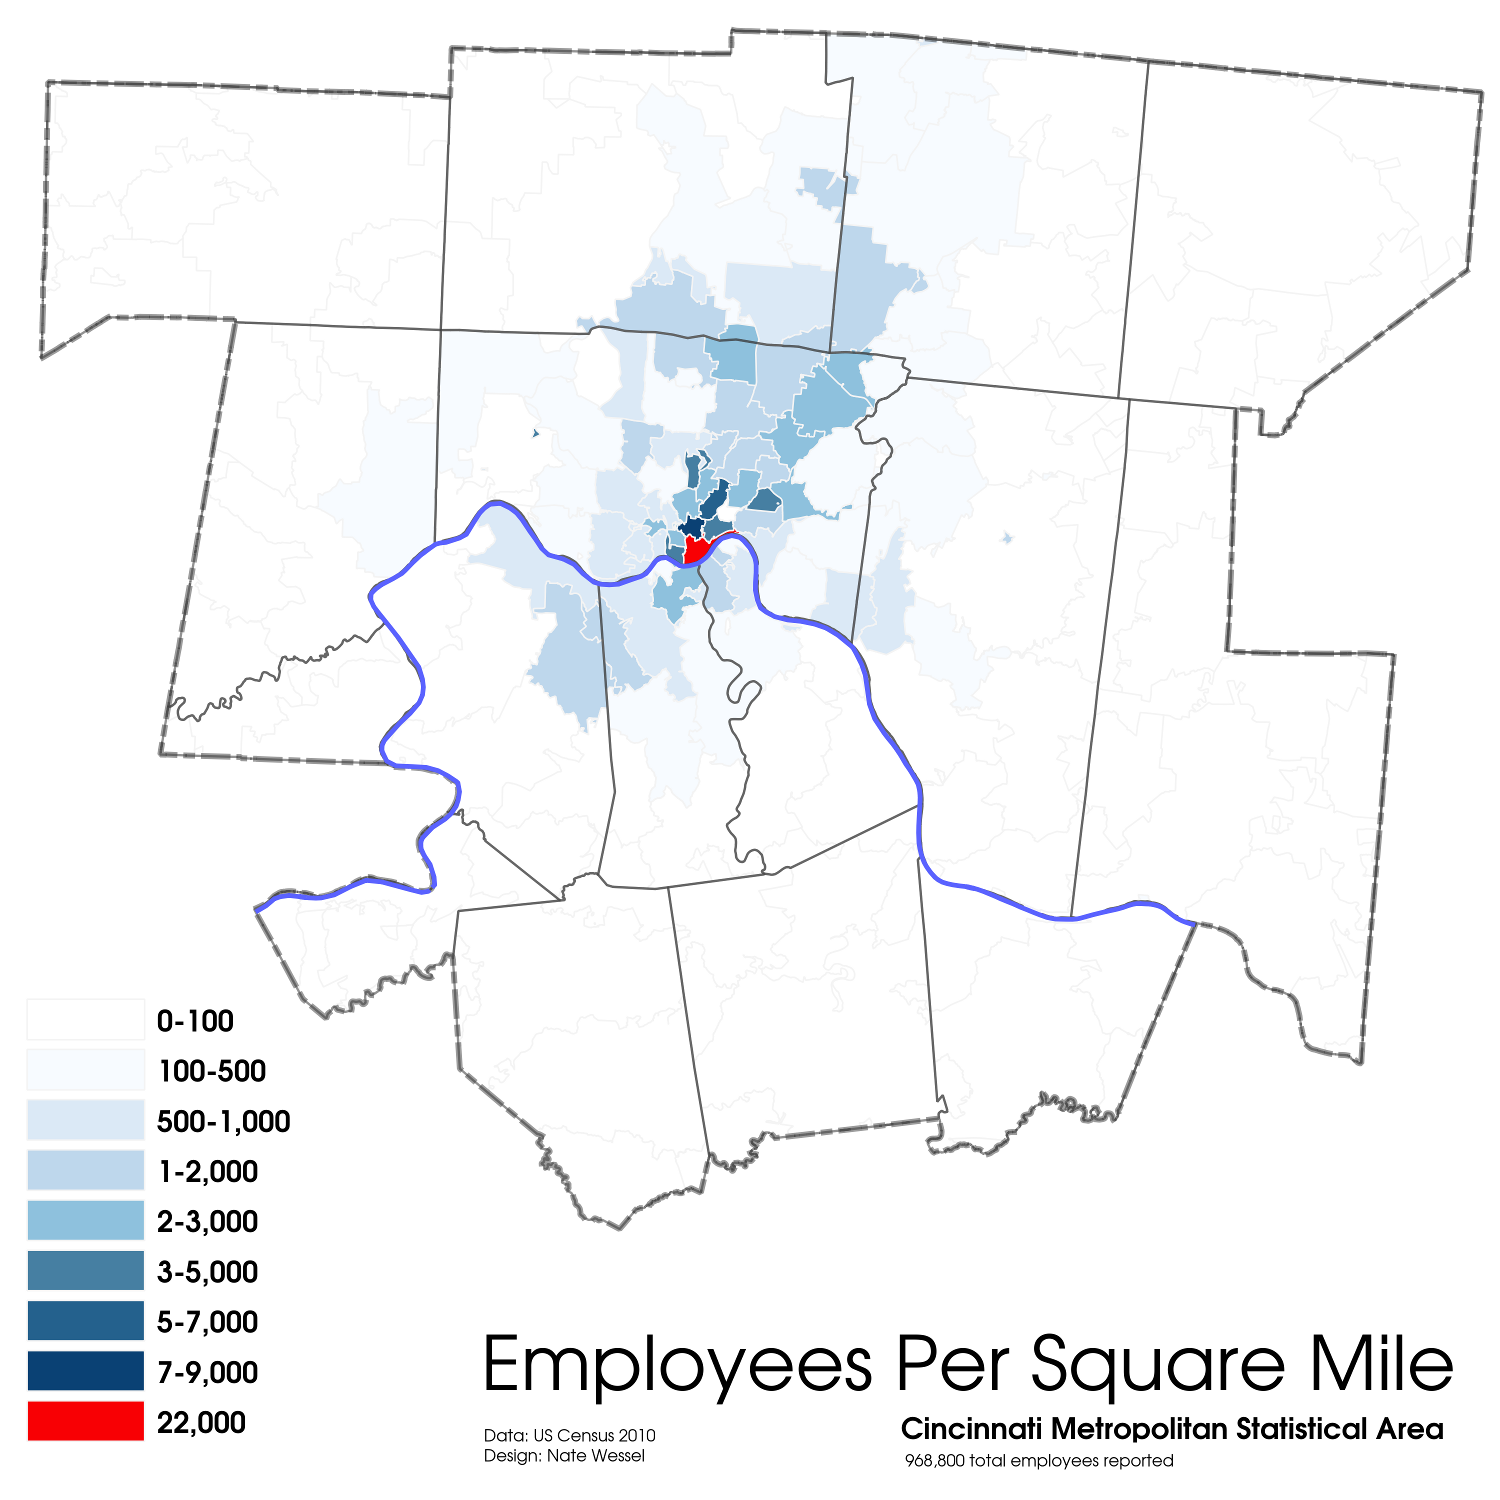
So what would the move mean for those living without a car in Hamilton County? In short, it would make voting a lot more difficult – especially for those in the eastern part of the county. It would also mean that the elections office and lone early voting location for Hamilton County would be moving further away from the population center and where most people work.

Those coming from the transit center at Anderson Towne Centre would see a four-hour round-trip, if they made all of their transfers seamlessly and nothing ran behind schedule. Those in the center city, the most densely populated area in the county, would need to block out several hours to account for the two-hour round-trip journey from Government Square.

If you are trying to get to the new Mt. Airy location from the Glenway Crossing Transit Center, Uptown Transit District or Kenwood Towne Center, your travel time would largely remain unchanged. That is if those people lived within a close walk to those transit centers like those near Government Square. The reality is that each of those three areas are much less walkable and would take considerable time accessing on their own right, thus adding significantly more time to the journey.

Cincinnati Population Density Cincinnati Employment Density

Should Greg Hartmann (R), Chris Monzel (R) and Alex Triantafilou (R) move forward with this it will in fact make the elections office and lone early voting location more accessible for those with cars in the western and northern parts of Hamilton County. It would also, however, make it less accessible for those with cars in the central and eastern parts of the county, and also worse for those without a car at all.

What is troublesome is that those with a car have access to the existing site. Yes, they may have to pay to park, but that is a minor inconvenience that absolutely must be weighed against creating hours-long journeys for those without a car.

The burden would be shifted to those who already have the least in our community. We hope Hartmann, Monzel and Triantafilou realize this would be morally wrong and decide to keep non-back office and early voting operations of the Hamilton County Board of Elections downtown.