Categories
Development News

Columbus is not the biggest city in Ohio, and Indy’s not bigger than Boston

Following the release of the U.S. Census Bureau’s updated population numbers for American cities, much has been made about the urban rise of the west. Even the Census Bureau itself touted the growing number of cities with more than 1 million people – the vast majority of which are located west of the Mississippi River.

These numbers can be misleading, and often don’t even pass the smell test.

Is Jacksonville, for example, really a bigger city than Detroit, Washington DC, Atlanta and Boston? Or out west, would most people actually consider Phoenix to be a larger city than San Francisco, Seattle, Denver or San Diego? Of course not.

In both scenarios, however, that is precisely the case. That is because the municipal boundaries for Jacksonville (885 square miles) and Phoenix (517 square miles) are disproportionately large compared to the population of their city. Closer to home the same is true for Columbus (223 square miles), Indianapolis (368 square miles) and Charlotte (298 square miles) – all of which skew the average population density for cities east of the Mississippi downward due to their huge municipal footprints.

If you were to simply pick-up a daily newspaper and read the listing of America’s most populated cities, you would not get this full perspective and perhaps be misled to think that Columbus is the biggest city in Ohio, or that Indianapolis is the fifth largest city east of the Mississippi River.

Using this same practice, some might consider Cincinnati to be a small city that doesn’t even crack the top 30 in the United States.

Of course, we know all of this is skewed by all sorts of factors. Some cities sit on state or county lines, others follow historical boundaries from hundreds of years ago that have never changed, while other are granted more liberal annexation capabilities. In short, it’s politics.

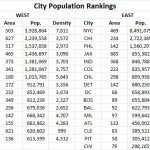
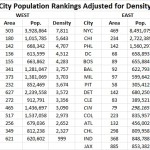
Now if we were to look at America’s 30 most populous cities again, but rank them by population density instead of overall population, the picture would change rather dramatically. Most cities in the west fall considerably, while older cities in the east would rise. The outliers that have artificially inflated their boundaries over the years also fall into a more normalized position on the chart.

While Cincinnati is not in the top 30 in terms of population, we considered it anyways since this is UrbanCincy after all. After adjusting for population density, Cincinnati would vault all the way to the 16th “biggest” city in America, just behind Denver and ahead of Dallas. This is also more in line with Cincinnati’s metropolitan population ranking that falls within the top 30 in America.

Those cities in this analysis that are in the east have an average population density, outliers included, of 6,579 people per square mile, while those in the west, come in at 3,804 people per square mile.

If outliers like Jacksonville actually were as large as they project, and followed the average population density for the region, it would need to add close to 5 million people. Likewise, Indianapolis would need to add around 1.6 million people and Charlotte 1.1 million. Local politics and market conditions in each of these cities will never allow for this many new people to move within city limits.

The Washington Post is correct in that the west is getting more populated and urbanizing at a fast pace, but let’s not get ahead of ourselves. The most populated cities in the west would only be average, at best, in the east if they were judged by population density instead.

Now, factoring for population-weighted density would be an entirely different ballgame.

Categories
Development News

Cincinnati Scores Slightly Better Than National Average on Sustainable Use of Land

Three percent of the Earth’s surface is developed land, not including farmland. While this may seem like a small percentage, it is the type of development that has created major problems for sustainable living conditions.

With an emphasis on single-family residential developments, auto-oriented planning, and an enormous supply of open land, it has become common knowledge that American cities are more sprawling than their global counterparts. These development patterns, although not entirely confined to the United States, are unique to American planning and have resulted in more sprawl and less sustainable development over the years.

This can plainly be seen by comparing dense European suburbs to American post-WWII sprawling suburbs. Further emphasizing this point today is that while the European Union has identified the percentage of developed land as one of 155 sustainable development indicators in terms of humanity’s ecological footprint, the United States has only noted its land use patterns but not used them as a factor in planning.

A new study, released in March by environmental engineering professors Dr. Giorgos Mountrakis and Dr. George Grekousis at the SUNY College of Environmental Science & Forestry, confirms the premise that America’s population growth does in fact consistently result in increasing land consumption, with the results varying between different states and counties where land management policies differ.

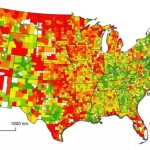
Their study used satellite imagery of the contiguous United States to measure the exact amount of developed land (DL) in 2,909 counties, excluding the outliers in the 100 least populated and 100 most populated counties. They then compared imagery from 2001 to the 2000 Census count in order to rank each county on what they call its DL efficiency. To make for more accurate comparisons, they then compared the results of each given county to the 100 counties closest to it in size (50 smaller and 50 larger).

Using this standard measurement, when Hamilton County was measured it came in at 43rd in its peer group. In this study, those counties with higher scores are considered to be more inefficiently developed. This means that Hamilton County came in slightly ahead of the curve when compared to its peers, which had an average rank of 51.

While the study shines a light on population growth and development patterns, it also reveals several socio-economic differences between similarly sized counties. Perhaps the most significant finding was that there seems to be a linear correlation between DL usages and population growth. For example, the researchers found that population growth of a county can be estimated by comparing its current DL usage to its past usage to then produce an estimate within a 95% confidence level. The larger the city gets, the more sprawling it will become at a consistent rate.

The study also confirmed that, compared to other developed countries, the United States is more inefficiently developed and that American cities tend to grow horizontally as population rises instead of vertically.

With this in mind, the report projects that the anticipated 30% population growth, between 2003 and 2030, will result in a 51% increase in land consumption. This equates to 44.5 million acres of land converted to residential and commercial development, and follows a trend of Rural Non-Metropolitan Statistical Areas developing land at nearly twice the rate of urban and suburban Metropolitan Statistical Areas.

One of the commonalities amongst low land consumption MSA counties, the SUNY researchers found, was that they were mostly located in states and cities with stronger planning agencies and urban growth boundaries. Furthermore, nearly all of the cities in these counties also had experienced rapid growth pre-automobile.

With a ranking of 43, Hamilton County comes in slightly better than the national average in its peer group. Elsewhere in Ohio, Clermont County ranked at 20 in its peer group, perhaps due to its makeup of 19th century towns and propensity of farms. And reflecting the dominance of post-war suburban housing, Butler and Warren Counties bring up the back of the pack at 62 and 55, respectively.

The three urban counties in Northern Kentucky, meanwhile, followed the larger trend for Kentucky overall and were found to be very efficient in their land use when compared to their peer groups.

For comparison, the Cincinnati metropolitan region as a whole scored better than those in Seattle, St. Louis, Kansas City, Orlando, Oklahoma City and Charlotte.

When Cincinnati’s population peaked in the mid-1950’s, it had over 500,000 residents within the city limits, while that number stood at just under 300,000 in the 2010 Census. This means that as the urban core continues to revitalize and add population, land that has become underutilized or abandoned will have the potential to be redeveloped, adding to the city and county’s density, and thus further improving its ranking.

Categories
Up To Speed

As the city grows in popularity, should Cincinnati hire a nightlife manager?

As the city grows in popularity, should Cincinnati hire a nightlife manager?.

When more people move into the city, and more businesses open up, the level of night time activity also tends to increase. In fact, about five years ago, many policy makers were striving to create “24/7” communities in their respective cities. Of course, not everyone can be New York, nor should they be. But as this level of nightlife increases in repopulating cities, should local governments be thinking of how to manage it? More from Urbanful:

You’ve seen the story before: A decent neighborhood starts to get noticed for its potential. A few bars come, then a few restaurants, and with them an increasingly steady stream of people. A few years down the road, it turns into a bonafide entertainment destination. It’s a story that’s playing out more and more as a growing number of people are making their way back into the cities to live. But it’s not all roses: up-and-coming neighborhoods have to manage the influx of nighttime activity their presence brings.

Pittsburgh’s renaissance has had its fair share of the issue. Business districts either border or seep into residential areas, presenting a major issue for residents. There have been grumblings for years about the noise violations, litter, parking issues, and other concerns attributed to young folks heading out to have a good time. But the city has taken a proactive approach to tackling the problem by hiring a night-time economy manager tasked with acting as a liaison between residents, local businesses and government entities to ensure all parties are satisfied in the development of the nighttime economy.

Categories
Up To Speed

Could a different design approach change the conversation about skateparks?

Could a different design approach change the conversation about skateparks?.

There aren’t many official skateparks throughout the region. Some spaces have become popular destinations for skateboarders, while others have been labeled as unwelcoming due to their designs intended on keeping skateboarders away. But has the design of skateparks often been their ultimate road block from being implemented, and would a more multi-purpose design help rectify that? More from Next City:

Inga Saffron, the Philadelphia Inquirer’s architecture critic, noted in her review that Franklin’s Paine Skatepark Fund had to raise $4.5 million to bring their vision for Paine’s Park to life, and they did so by “badgering state, city, and private funders to pay for the project.” The space reveals the shift in how skateboarders and architects imagine skateparks. But it also represents a surge of civically engaged skateboarders who are taking city building seriously. The kids who clung to their boards in the ’80s and ’90s have grown up, some of them into advocates. San Antonio has a “skate plaza” program. Seattle welcomes boards not only to skateparks, but “skate spots” (1,500 to 10,000 square feet) and “skate dots” (smaller than 1,500 square feet). Portland’s system has branched out to designate skateboard routes in the city’s downtown.

Categories
Business Development News

Cincinnati Gentrified at One of Nation’s Fastest Rates Immediately Following Housing Boom

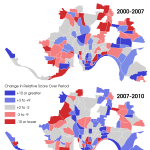
During the housing boom years between 2000 and 2007, many cities saw an influx of new housing and new wealth into their core neighborhoods. It was a trend that was consistent throughout America as wealthier individuals looked to move back into the cities that had been abandoned in prior decades.

This trend was more pronounced in some cities – Atlanta, Washington D.C., Denver, and Seattle – than others. But for the most part, the majority of the cities were gaining wealth relative to their regional average. Following the burst of the housing bubble, however, virtually every city saw this rate of improvement slow down.

According to research from the Federal Reserve Bank of Cleveland, the majority of 59 cities studied now fall between either a one percentile decline or one percentile increase between 2007 and 2010. This is in contrast to the housing boom period which saw cities like Atlanta and Washington D.C. move up 8.7 and 5 percentiles respectively.

“During the housing boom, a number of large cities in the United States experienced redevelopment in their lower-income neighborhoods as higher-income residents moved in, a process known as gentrification,” wrote researcher Daniel Hartley. “Since lending standards have tightened with the onset of the housing bust and the financial crisis, we wondered whether gentrification has continued after the recession in places where it was happening before.”

The results of their research found that only a select handful of regions reasonably continued to see relative wealth growth in their principal cities. The findings also detected one region that bucked the trend and actually increased its gains over the housing boom period.

“Another interesting case is Cincinnati, which barely changed in income ranking from 2000 to 2007 but has increased at a pace similar to Denver or Washington during the 2007 to 2010 period,” the research team noted.

Hints of such activity were realized in December 2013 when UrbanCincy uncovered that census tracts all over the city were experiencing wealth increases.

While the gains in wealth may seem like a positive thing for the city, not everyone is so thrilled about the changes taking place in Cincinnati.

“It seems to me what this information really indicates is how, when people experiencing poverty are systematically removed from a certain area, and housing stock is renovated with the goal of selling to wealthier people, property values increase,” says Jason Haap, an area teacher and prominent advocate for the city’s homeless population. “The fact that Cincinnati has seen gentrified growth during a time of slow economic growth in minority communities further exacerbates the situation.”

One of the tools in order to prevent the displacement Haap mentions from happening is including ‘set asides’ in new developments for affordable housing. The Cincinnati Center City Development Corporation (3CDC) has done this a bit in Over-the-Rhine at projects like Mercer Commons and Bremen Lofts, but there is no official city policy or requirement to do so.

What also factors into the relative changes studied by the Federal Reserve Bank is the widespread poverty and low income levels of those living within city limits. Thus, even nominal improvements would show up as a potentially significant increase.

We do know, however, that some housing prices, particularly in the city center where demand is highest, are starting to get out of hand. Most new apartment developments in the Central Business District now feature rents of $2,000 or more per month, and in one recent case, a three bedroom flat on Sixth Street rented for a whopping $4,600 per month.

In such cases it is leaving many now wondering if these prices are not only driving out existing residents but, paradoxically, also preventing many new potential residents from moving in.

“Demand in Cincinnati’s core is insatiable, and supply is only coming online at a trickle,” explained Derek Bauman, an urban development consultant and chairman of Cincinnatians for Progress. “Without urban housing supply, we may miss the coming wave of new residents. At nearly $2 per square-foot rents and $250-$300 a square-foot sales, we may not have Manhattan prices yet, but we’re damn near Brooklyn.”